phet_mpa_2010157_tn.png
0 x 0
PNG
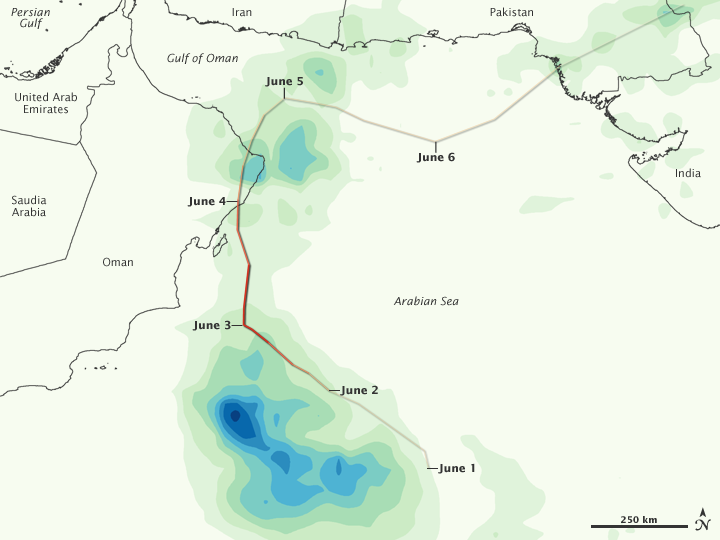
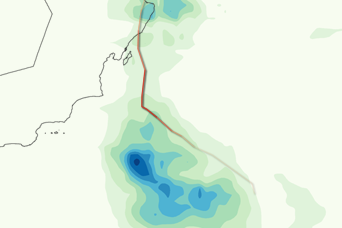
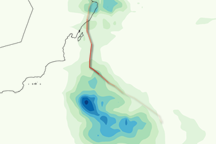
Tropical Cyclone Phet
This color-coded image shows the storm track and rainfall amounts for Tropical Cyclone Phet from May 31 to June 6, 2010.
This image originally appeared in the NASA Earth Observatory story Tropical Cyclone Phet.
NASA Earth Observatory image by Jesse Allen, using near-real-time data provided courtesy of TRMM Science Data and Information System at Goddard Space Flight Center. Caption by Michon Scott.
Published June 8, 2010
Data acquired May 31 - June 6, 2010
- Source:
- TRMM > MPA